
Powerlifting data analysis
How much can you improve your DOTS score in a year?
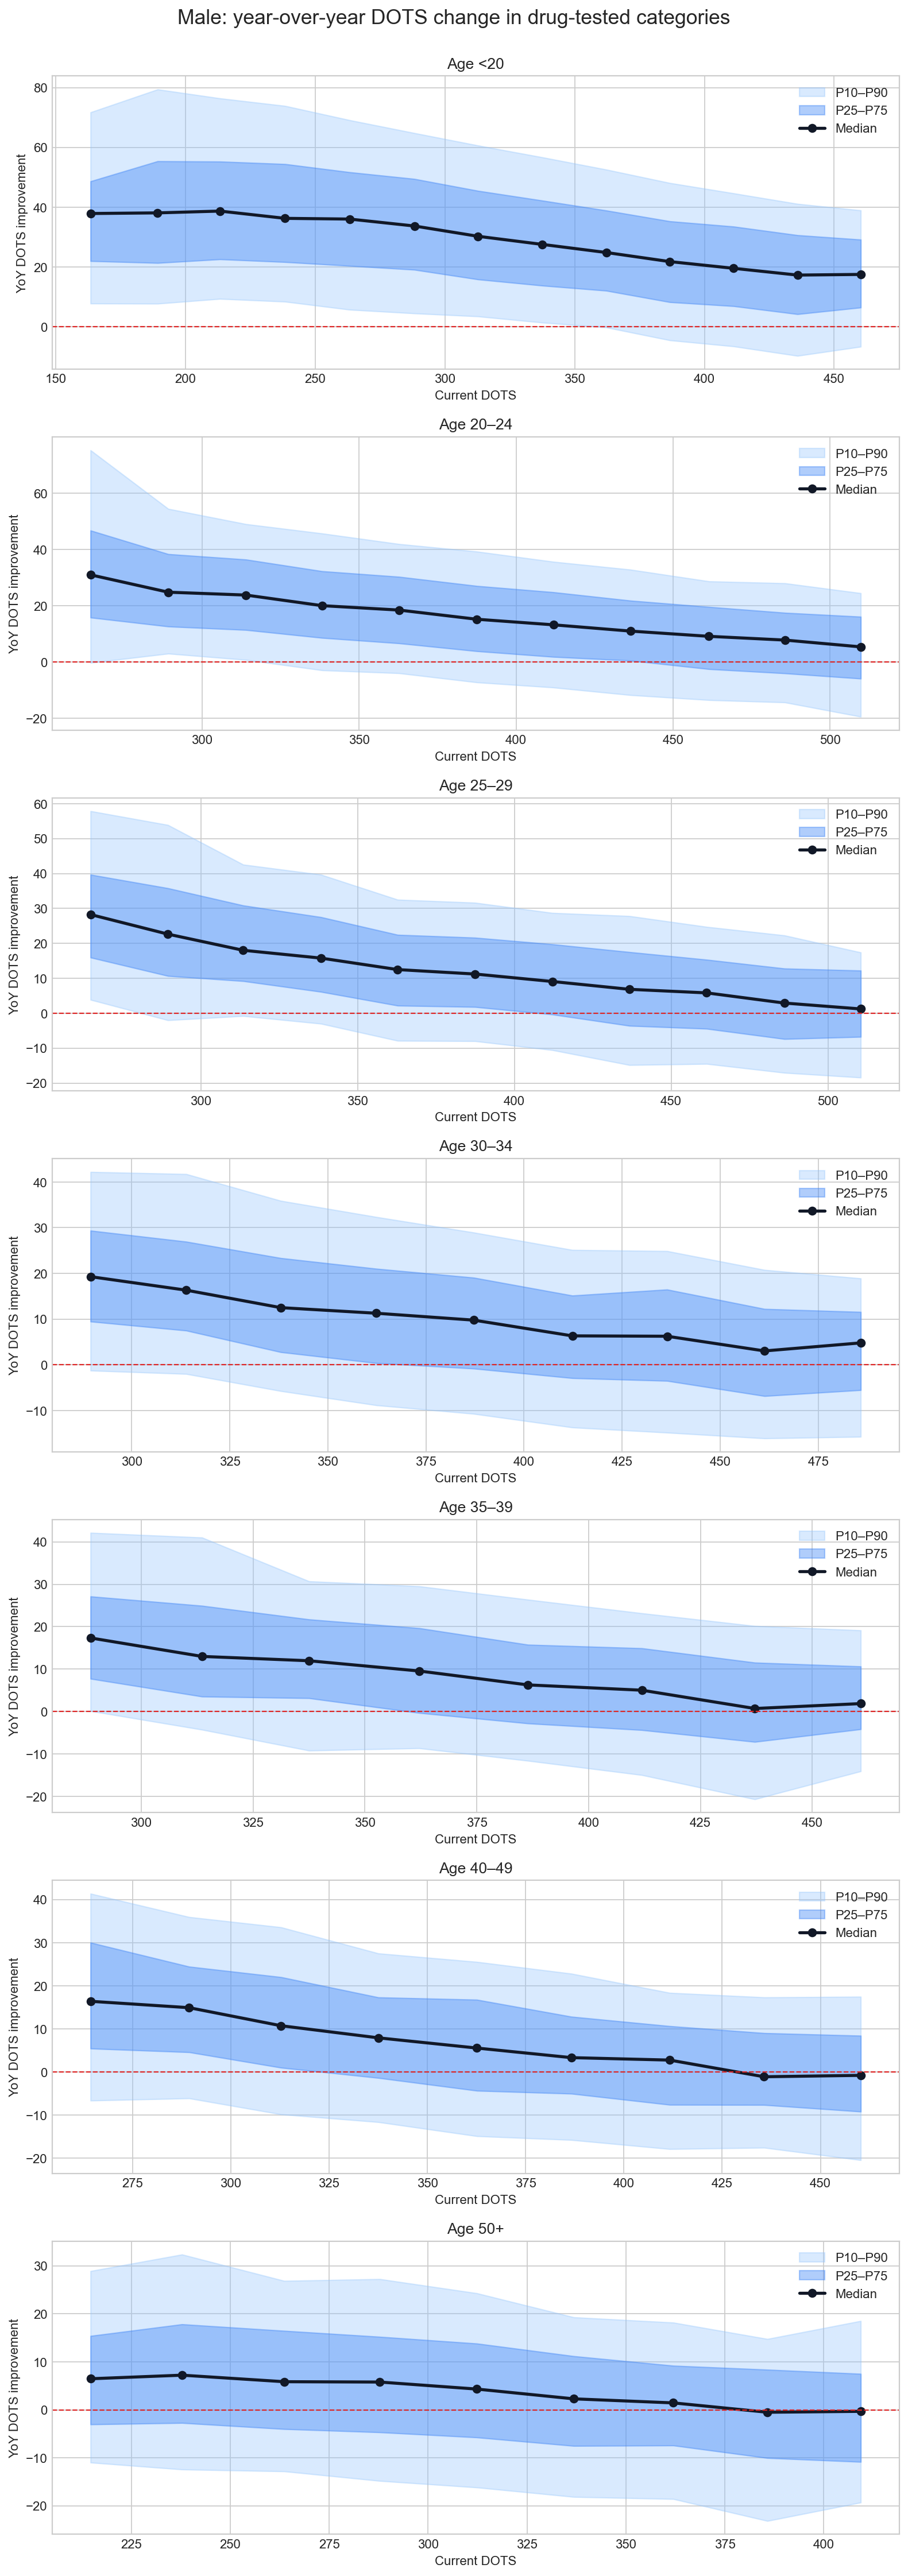
The overall trend is clear: powerlifters with a lower DOTS score usually improve faster. As lifters become stronger and older, their typical yearly improvement becomes smaller. For example, male lifters aged 30–34 with about 400 DOTS improved by roughly 7–8 DOTS at the median over the following year.
Find your typical one-year DOTS improvement
Use the charts in four steps:
- Choose the male or female chart.
- Find your age group.
- Find your current DOTS score along the bottom of that chart.
- Follow it up to the black line, then read your typical one-year DOTS change on the left.
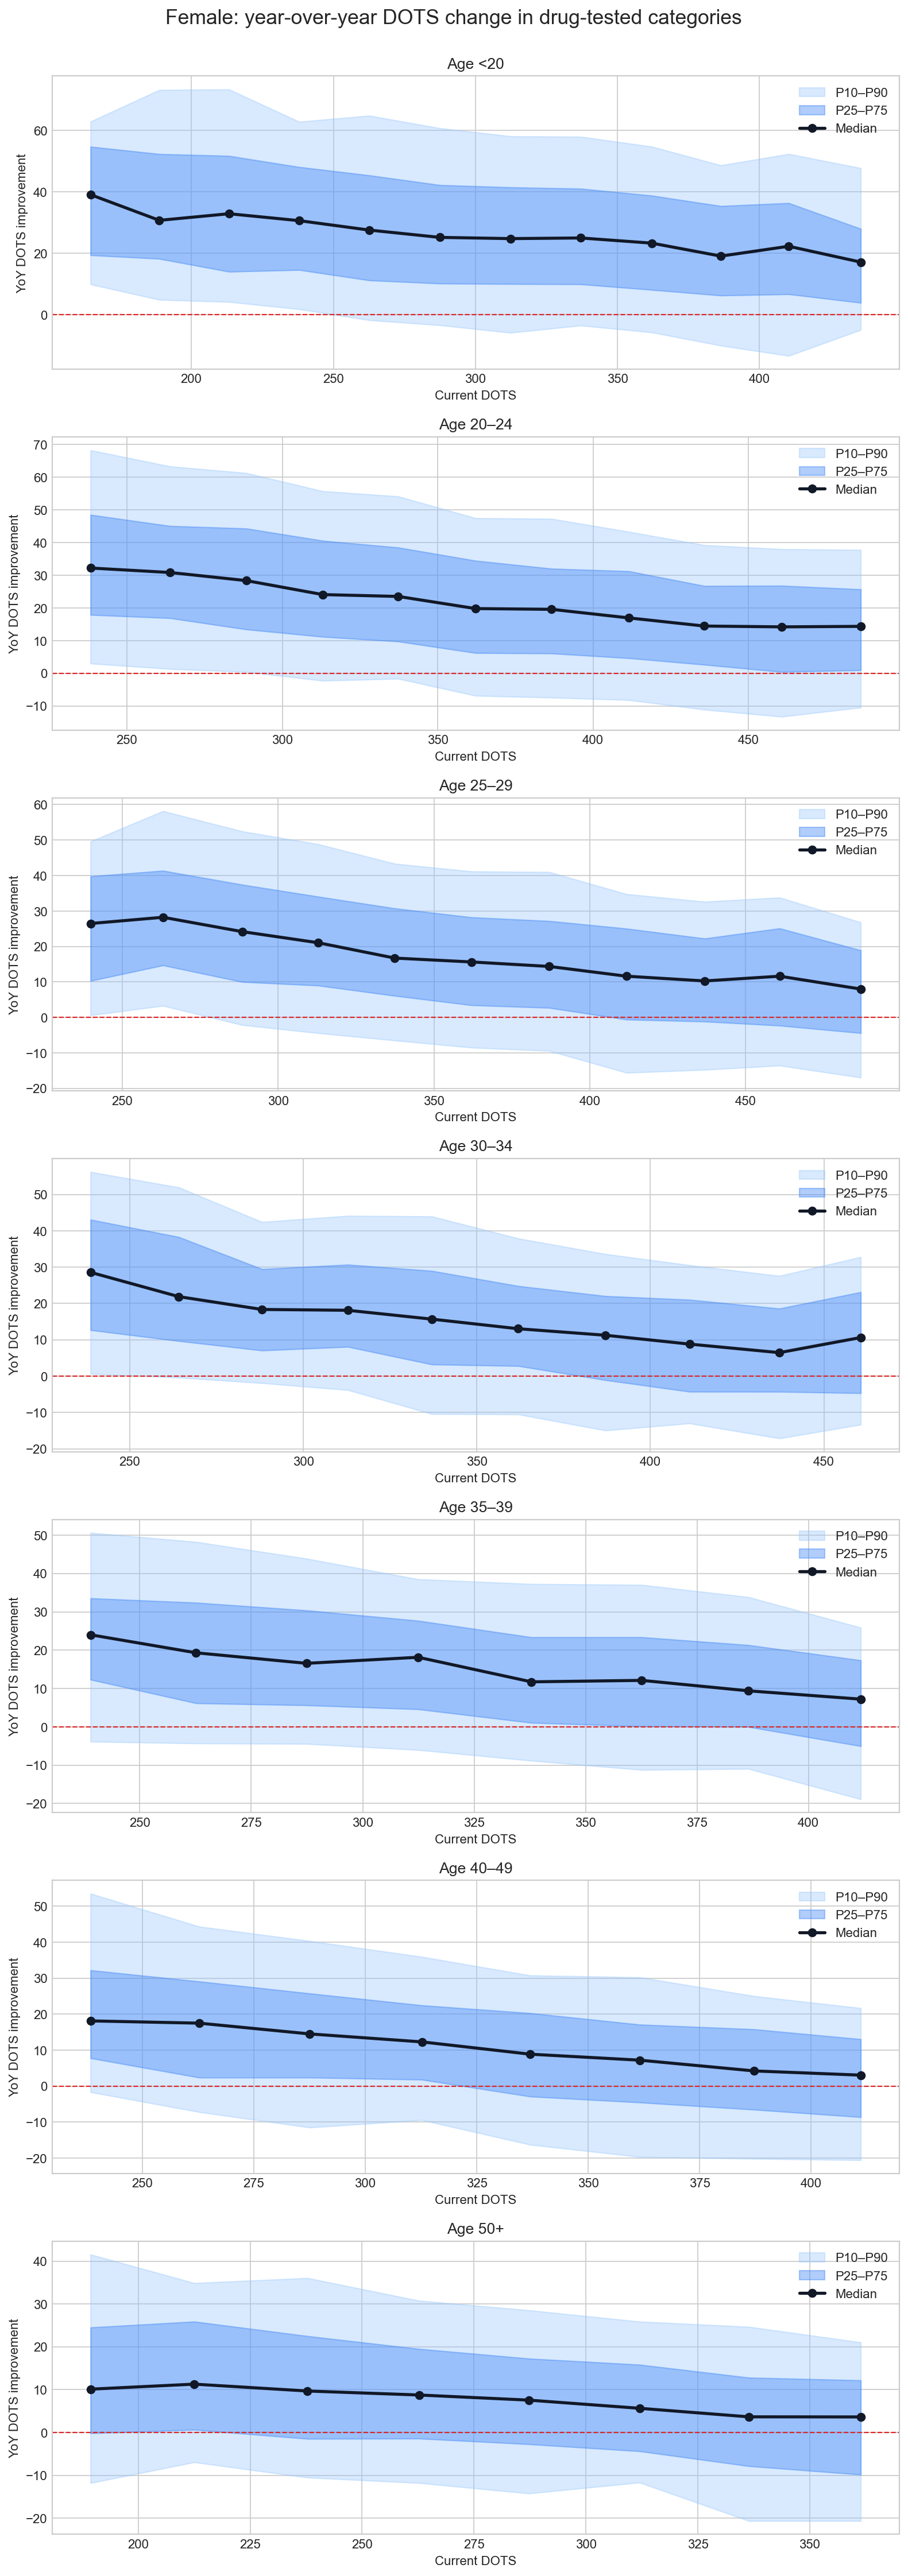
The black line is the median: half of similar results improved more and half improved less. The dark blue area contains the middle half of results, while the light blue area shows the wider range from the 10th to the 90th percentile. A result above the red zero line means a higher DOTS score one year later.
Male competitors
Select your age group, then use the black line to read the median improvement at your current DOTS score.
Female competitors
Select your age group, then use the black line to read the median improvement at your current DOTS score.
What the charts show
Advanced powerlifters progress more slowly
The median line generally slopes downward as current DOTS rises. Lifters starting with a lower score tend to make larger gains, while highly advanced lifters tend to add fewer DOTS points over the next year.
Progress generally slows with age
At a similar DOTS score, younger groups usually show a larger median improvement than older groups. The difference is gradual rather than a sudden drop at one particular age.
There is still a wide range of results
The blue areas are wide in most groups. Two lifters of the same sex, age, and current DOTS can have very different years, so the median is a useful starting point rather than a personal limit.
Focus on the broad trend
Small bumps in a line can come from normal variation in the data. The repeated pattern across the charts matters more: yearly gains tend to shrink as age and current DOTS increase.
How this analysis was created
The charts use OpenPowerlifting meet results from 2010 onward. The analysis included sanctioned, Raw, full-power results recorded as drug-tested categories, with a valid DOTS score and reported age.
For each lifter, the best DOTS performance in one year was compared with their best performance in the following year, provided the meets were 9 to 15 months apart. Results were then grouped by sex, age, and current DOTS. Each chart point includes at least 100 lifters.
A lifter with several years of results was given the same total influence as a lifter with one comparison, preventing long competition histories from dominating the charts.
In total, the charts include 98,497 one-year comparisons from 65,727 lifters.
- Source results
- 4,001,901
- Included in this analysis
- 98,497
Limitations
- Meet results show competition progress, which may not equal the improvement seen in day-to-day training.
- Only 22.4% of possible starting results had another recorded meet in the required time window. Lifters who returned may differ from those who did not.
- The data does not include training experience, program quality, consistency, injuries, or body composition.
- A best meet result can still be affected by meet selection, preparation, and an unusually good or bad day.
- Age was missing for 15.3% of otherwise qualifying results.
- OpenPowerlifting’s tested label means the result counted as drug-tested; it does not confirm that every competitor was personally tested or drug-free.
- There were too few results in the Mx category to create a reliable age-and-DOTS chart.
From a general trend to a personal estimate
These charts provide a useful overview, but they still group together lifters who may have very different bodyweights and strengths in the individual lifts. After seeing the general trend, I wanted a more personal answer: how did competitors who were actually similar to me improve?
That led to the powerlifting progress calculator. Enter your sex, age, bodyweight, squat, bench press, and deadlift, and it finds 100 similar competitors to estimate the one-year change in DOTS and each lift. You can also read the calculator methodology to see exactly how those matches are selected.
Data source
- OpenPowerlifting project bulk data, local export dated 15 August 2026. OpenPowerlifting